Which fiber optic power meter detector do I need?
It is important to correctly match the power meter detector type to the application.
The correct detector for loss and power measurements on fiber optic communications systems will generally be as follows:
InGaAs (Indium Gallium Arsenide)
- Precision measurement over 1300 - 1650 nm wavelength bands.
- Reduced measurement accuracy over 850 nm band due to wavelength sensitivity.
- Maximum fiber core size 100 u.
VE Visual Enhanced (InGaAs)
- Precision measurement over 850 - 1650 nm wavelength bands.
- 3x better accuracy than InGaAs across the 850 nm band, due to improved wavelength responsivity stability.
- May have lower maximum power level specification.
- Maximum fiber core size 50 u.
H series / high power (attenuated InGaAs)
- Used for high power measurements. Choose from H5, H3B and H6 attenuation levels.
- These detectors are more expensive and have lower accuracy than normal InGaAs detectors, so only specify them if expecting to measure beyond the range of a non-attenuated detector.
- The peak or pulsed signal power must be within the meter range.
- High power meters have less AutoTest sensitivity, which is a consideration for loss testing.
- The KI2600-H5 or H3B offers the best balance for most high-power users, with up to +24 dBm range & reasonable Autotest sensitivity.
- The KI2600-H6 offers the highest power level of +33 dBm. For single mode fiber applications only.
XL series / large area
- Use XL series detectors for multi-fiber connectors such as MPO, MMC, or POF and other fibers above 200u active fiber core diameter.
- HCS is 200u core diameter, so a standard meter is just OK for HCS installers. A large area Si5 detector will ensure laboratory grade results.
- Select from Si5, Ge5, Ge7 or InGaAs5 using the above guidelines.
- A Silicon detector is ideal for visible, POF & 850nm.
- MPO connectors with 16 and 32 fibers require the larger Ge7 detector, which also works with other MPO fiber counts.
- XL series detectors typically work with many connector styles, including e.g. LC, SC, FC & MPO, so are very versatile.
- Large area InGaAs detectors are very expensive and are typically used in laboratory applications. For fiber optic installation applications from e.g. 850 - 1550 nm, a Ge detector is typically adequate.
What power level is the system?
Maximum system power level expectations
- Most Telco digital transmission systems have maximum power levels below +5 dBm.
- Most LAN transmission systems have maximum power levels below 0 dBm.
- Specialist systems, typically RF or analogue, without an optical amplifier, have maximum power levels below +15 dBm.
- Long distance systems with an optical power amplifier have maximum (fault) power levels below +23 dBm.
- On installed single mode systems with standard polished-fiber connectors (SC / LC / FC etc.), total long-term system (fault) power per fiber cannot go above +23 dBm per fiber, owing to connector power density limitations. In fact, for routine operations, +18 dBm is regarded as a maximum, above which special operational precautions are needed to avoid catastrophic connector / system failure.
- For systems operating above +18 dBm, typically either no connector, or expanded beam connectors are used, due to the extreme power density. Anything above +23 dBm tends to be a "non-installed" R&D system. R&D bench customers report using up to +33 dBm temporarily, on single mode fiber systems.
Minimum system power level expectations
- It's rare to encounter system power levels below -35 dBm.
- Use of a fiber amplifier pre-amp can extend recover sensitivity down to between -40 to -45 dBm.
- Use of a power meter on a cabling system below about -45 dBm is problematic, due to the possibility of stray sunlight leaking into exposed cabling.
Useful graphs
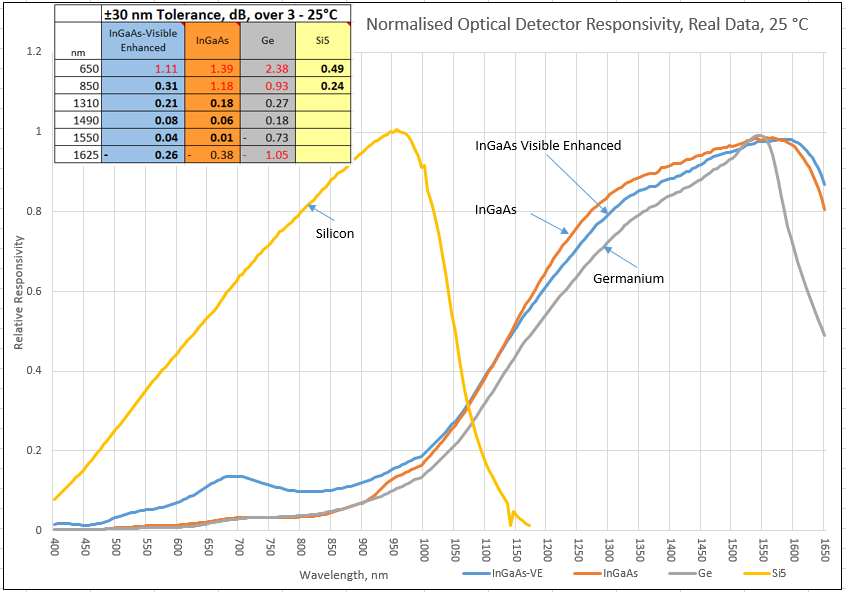
Power meter responsivity wavelength dependence

Ge vs InGaAs responsivity @ long wavelengths
- The above graph shows the room temperature response of power meters with Ge & InGaAs detectors as the wavelength is changed beyond 1500 nm.
- The Ge meter is unsuitable for work on CWDM and DWDM systems above 1550 nm, the InGaAs meter is obviously a much better choice, since it is very stable. This graph uses real measurement data.
Ge response drift at over temperature @ 1580 nm
- The above graph shows how the 1580 nm thermal response of a power meter with a Ge detector changes with temperature.
- This instability makes Ge power meters basically unsuitable for field work on CWDM and DWDM systems above 1550 nm.
- The thermal stability below 1550 nm is much better, around 0.2 dB, however it's never as good as InGaAs. This graph uses real measurement data.
More information